Tag: memory leak

Ruby: Stream processing of shell command results

There are various methods for calling shell commands in Ruby. Most of them either not wait at all for the results, or wait until the command execution is finished.

In many cases it is ok, because programmers want shell command results for further processing. Unfortunately this means that while a shell command runs, there's no way to get partial results and process them (multitasking FTW). It also means that all the results have to be buffered. It might be (for a long running intensive commands) a source of memory leaks in your applications.

Luckily there's a great way to process shell command data in a stream (row after row).

The task

Lets assume that we want to find first 10 files in our file system that match a given pattern (note that it could be achieved way better with just shell commands but it's not the point here).

The bad way

Here's a typical code to achieve that (and believe me - I've encountered solutions like that in production systems):

require 'memory_profiler'
report = MemoryProfiler.report do
  pattern = /test/
  results = `find / 2> /dev/null`.split("\n")
  selection = results.select { |file| file =~ pattern }
  selection[0..10]
end

report.pretty_print

This might seem elegant and it definitely works, but let's check Ruby's process memory usage:

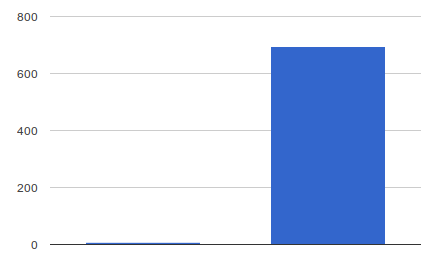
Memory usage in MB (before and after find)

Total allocated: 661999052 bytes (2925598 objects)
Total retained:  40 bytes (1 objects)

allocated memory by gem
-----------------------------------
 661999052  other

allocated memory by class
-----------------------------------
 632408588  String
  26181752  Array
   3408440  MatchData
       232  Hash
        40  Process::Status

We had to use nearly 700MB of memory and it took us 4.7 seconds just to find few matching files. The time wouldn't be that bad,  but memory usage like this is a bit overkill. It is bad mostly because find / lists all the files and the more things we have, the bigger output we get. This also means that our code will behave differently dependent on what machine it will run. For some we might not have memory problems but for others it might grow over 1GB.

Now imagine what would happen if we would execute this code in 25 Sidekiq concurrent workers...

Of course with GC running we might not kill our machine, but memory spikes will look kinda weird and suspicious.

The good way - hello IO.popen

Instead of waiting for all the files from find / command, let's process each line separately. To do so, we can use the IO.popen method.

IO.popen runs the specified command as a subprocess; the subprocess’s standard input and output will be connected to the returned IO object. (source)

It means that we can execute find command and feed our main process with every line of the output separately.

Note: IO.popen executed without a block will not wait for the subprocess to finish!

require 'memory_profiler'
report = MemoryProfiler.report do
  pattern = /test/
  selection = []

  IO.popen('find / 2> /dev/null') do |io|
    while (line = io.gets) do
      # Note - here you could use break to get out and sigpipe
      # subprocess to finish it early. It will however mean that your subprocess
      # will stop running early and you need to test if it will stop without
      # causing any trouble
      next if selection.size > 10
      selection << line if line =~ pattern
    end
  end

  selection[0..10]
end

report.pretty_print

Results:

Total allocated: 362723119 bytes (2564923 objects)
Total retained:  394 bytes (3 objects)

allocated memory by gem
-----------------------------------
 362723119  other

allocated memory by class
-----------------------------------
 362713215  String
      8432  IO
      1120  MatchData
       232  Hash
        80  Array
        40  Process::Status

45% less memory required.

The best way (for some cases)

There's also one more way to do the same with the same #popen but in a slightly different style. If you:

  • Don't need to process all the lines from the executed command
  • Can terminate subprocess early
  • Are aware of how to manage subprocesses

you can then stream data into Ruby as long as you need and terminate once you're done. Than way Ruby won't fetch new lines and won't have to GC them later on.

require 'memory_profiler'
report = MemoryProfiler.report do
  pattern = /test/
  selection = []
  run = true

  io = IO.popen('find / 2> /dev/null')

  while (run && line = io.gets) do
    if selection.size > 10
      Process.kill('TERM', io.pid)
      io.close
      run = false
    end

    selection << line if line =~ pattern
  end

  selection
end

report.pretty_print

Since we don't wait for the subprocess to finish, it definitely will be faster but what about memory consumption?

Total allocated: 509989 bytes (5613 objects)
Total retained:  448 bytes (4 objects)

allocated memory by gem
-----------------------------------
    509989  other

allocated memory by class
-----------------------------------
    499965  String
      8432  IO
      1120  MatchData
       232  Hash
       200  Array
        40  Process::Status

99% less than the original solution!

Note: This solution is not always applicable.

Summary

The way you execute shell commands really depends on few factors:

  • Do you need an output results at all?
  • Do you need all the lines from the output at the same time?
  • Can you do other stuff and return once the data is ready?
  • Can you process partial data?
  • Can you terminate subprocess early?

When you go with your code out of Ruby scope and when you execute shell commands, it is always good to ask yourself those questions. Sometimes achieving stream processing ability can be done only when the system is being built, so it is really good to think about that before the implementation. In general I would recommend to always consider streaming in every place where we cannot exactly estimate the external command result size. That way you won't be surprised when there will be a lot more data that initially anticipated.

Note: Attentive readers will notice, that I didn't benchmark memory used in the subprocess. That is true, however it was irrelevant to our case as the shell command for all the cases was exactly the same.

Cover photo by: heiwa4126 on Creative Commons license.

Simple Ruby(Rails) Passenger memory consumption limit monitoring

Apache Passenger is quite nice for smaller applications (or on a server with multiply apps). It is easy to deploy, maintain and upgrade. However it has also some limitations. For example we cannot set max memory consumption limit. We can set PassengerMaxRequests limit - so each Passenger instance will be killed after N requests, but this won't help us, when Passenger instance suddenly get really big (150 and more MB).

If you use MRI instead of REE on production, you can encounter this issue. Standard small app worker should consume around 75-125MB of memory. But sometimes, something goes crazy and they start to grow rapidly until they reach memory limit. After that, server starts to respond really slow (or stop responding).

Passenger memory status to the rescue!

What can we do, to protect against such situations? First of all, we can monitor Passenger memory consumption with command passenger-memory-stats. The output should look like this:

---------- Apache processes ----------
PID    PPID   VMSize    Private  Name
--------------------------------------
1437   15768  178.1 MB  0.6 MB   /usr/sbin/apache2 -k start
3415   15768  178.0 MB  0.7 MB   /usr/sbin/apache2 -k start
3417   15768  178.1 MB  1.0 MB   /usr/sbin/apache2 -k start
4345   15768  178.1 MB  0.7 MB   /usr/sbin/apache2 -k start
4346   15768  178.2 MB  1.2 MB   /usr/sbin/apache2 -k start
4352   15768  178.1 MB  0.8 MB   /usr/sbin/apache2 -k start
4546   15768  178.0 MB  0.5 MB   /usr/sbin/apache2 -k start
4628   15768  178.1 MB  1.2 MB   /usr/sbin/apache2 -k start
4664   15768  178.1 MB  0.5 MB   /usr/sbin/apache2 -k start
4669   15768  178.2 MB  0.7 MB   /usr/sbin/apache2 -k start
4796   15768  178.1 MB  0.7 MB   /usr/sbin/apache2 -k start
5362   15768  177.7 MB  0.5 MB   /usr/sbin/apache2 -k start
6195   15768  178.0 MB  0.7 MB   /usr/sbin/apache2 -k start
6208   15768  209.3 MB  32.4 MB  /usr/sbin/apache2 -k start
6211   15768  178.0 MB  0.6 MB   /usr/sbin/apache2 -k start
6213   15768  177.6 MB  0.3 MB   /usr/sbin/apache2 -k start
6214   15768  178.0 MB  0.9 MB   /usr/sbin/apache2 -k start
6256   15768  201.7 MB  25.9 MB  /usr/sbin/apache2 -k start
6257   15768  177.9 MB  0.8 MB   /usr/sbin/apache2 -k start
6353   15768  177.5 MB  0.2 MB   /usr/sbin/apache2 -k start
15768  1      177.5 MB  0.1 MB   /usr/sbin/apache2 -k start
### Processes: 21
### Total private dirty RSS: 70.92 MB

-------- Nginx processes --------
### Processes: 0
### Total private dirty RSS: 0.00 MB

----- Passenger processes ------
PID    VMSize    Private   Name
--------------------------------^[[0m
1643   901.9 MB  105.0 MB  Rails: /rails/app/current
1658   900.6 MB  103.3 MB  Rails: /rails/app/current
3425   898.4 MB  95.4 MB   Rails: /rails/app/current
6323   874.2 MB  49.5 MB   Passenger ApplicationSpawner: /rails/app/current
6409   887.7 MB  62.9 MB   Rails: /rails/app/current
15775  22.9 MB   0.3 MB    PassengerWatchdog
15778  164.5 MB  2.6 MB    PassengerHelperAgent
15780  43.1 MB   7.0 MB    Passenger spawn server
15783  136.9 MB  0.7 MB    PassengerLoggingAgent
32082  961.7 MB  126.9 MB  Rails: /rails/app/current
### Processes: 10
### Total private dirty RSS: 553.53 MB

We are particularly interested in Passenger processes section. To see just PID and MB consumption of all the workers, we could filter out unneeded data:

passenger-memory-stats | grep Rails:\ /home  | awk ' { print $1 " - " $4}'

So the output would look like this:

# PID - MEMORY USAGE
1643 - 105.0
1658 - 106.9
3425 - 99.1
6409 - 70.7
8381 - 0.1
32082 - 130.3

So now we can have a quick overview on how our server is doing.

I'm to lazy! I don't want to check it all the time. This should monitor itself!

It is quite obvious, that monitoring should be done in an automatic way. Of course it is recommended to check Passenger stats from time to time, but who would monitor and kill bloated Passenger workers on his one? Probably no one. That's why, we're gonna create a simple Ruby program, to monitor and shutdown gracefully (or kill if they don't want to shutdown) Passenger workers.

How to kill Passenger processes from Ruby?

Each Passenger instance is a separate process and it has it's own PID. Killing processes from Ruby is really easy. We do this by executing following command:

Process.kill(signal, pid)

We will use this method and try to kill Passenger processes gracefully (gracefully means that Passenger process will complete any request that it is performing right now and will shutdown). If this fails, we will send a TERM signal and kill it instantaneously.

  • SIGUSR1 signal - shutdown gracefully
  • TERM signal - kill it instantaneously

Final Ruby monitoring

Ok, so now we know how to kill Passenger process, there rest is simple - we need to extract PID and memory usage, set a limit, check it and kill every instance that exceeds this limit:

# Finds bloating passengers and try to kill them gracefully.
# @example:
#   PassengerMonitor.run
require 'logger'

class PassengerMonitor
  # How much memory (MB) single Passenger instance can use
  DEFAULT_MEMORY_LIMIT = 150
  # Log file name
  DEFAULT_LOG_FILE = 'passenger_monitoring.log'
  # How long should we wait after graceful kill attempt, before force kill
  WAIT_TIME = 10

  def self.run(params = {})
    new(params).check
  end

  # Set up memory limit, log file and logger
  def initialize(params = {})
    @memory_limit = params[:memory_limit] || DEFAULT_MEMORY_LIMIT
    @log_file = params[:log_file] || DEFAULT_LOG_FILE
    @logger = Logger.new(@log_file)
  end

  # Check all the Passenger processes
  def check
    @logger.info 'Checking for bloated Passenger workers'

    `passenger-memory-stats`.each_line do |line|
next unless (line =~ /RackApp: / || line =~ /Rails: /)

      pid, memory_usage =  extract_stats(line)

      # If a given passenger process is bloated try to
      # kill it gracefully and if it fails, force killing it
      if bloated?(pid, memory_usage)
        kill(pid)
        wait
        kill!(pid) if process_running?(pid)
      end
    end

    @logger.info 'Finished checking for bloated Passenger workers'
  end

  private

  # Check if a given process is still running
  def process_running?(pid)
    Process.getpgid(pid) != -1
  rescue Errno::ESRCH
    false
  end

  # Wait for process to be killed
  def wait
    @logger.error "Waiting for worker to shutdown..."
    sleep(WAIT_TIME)
  end

  # Kill it gracefully
  def kill(pid)
    @logger.error "Trying to kill #{pid} gracefully..."
    Process.kill("SIGUSR1", pid)
  end

  # Kill it with fire
  def kill!(pid)
    @logger.fatal "Force kill: #{pid}"
    Process.kill("TERM", pid)
  end

  # Extract pid and memory usage of a single Passenger
  def extract_stats(line)
    stats = line.split
    return stats[0].to_i, stats[3].to_f
  end

  # Check if a given process is exceeding memory limit
  def bloated?(pid, size)
    bloated = size > @memory_limit
    @logger.error "Found bloated worker: #{pid} - #{size}MB" if bloated
    bloated
  end

end

Source code is easy and it has comments so there is no need for further explanations. Usage is reduced to just one line:

PassengerMonitor.run

How to incorporate it into your Rails project and run it from cron?

Using this with your Rails app is really easy. First of all copy-paste the the source code from above and put it in /lib dir of your project, in a file called passenger_monitor.rb.

Then, create a file in /scripts named passenger_monitor.rb(or whatever) and insert there given code:

file_path = File.expand_path(File.dirname(__FILE__))
# Load PassengerMonitor from '/lib/passenger_monitor.rb'
require File.join(file_path, '..', 'lib', 'passenger_monitor')

# Set logger to log into Rails project /log directory and start monitoring
PassengerMonitor.run(
  :log_file => File.join(file_path, '..', 'log', 'passenger_monitor.log')
)

There is one more thing that we need to do. We need to set it up in cron, so it will execute every minute. To do so we type crontab -e and insert following line in our crontab:

* * * * * env -i /usr/local/bin/ruby /rails/app/script/passenger_monitor.rb

Of course remember to replace /rails/app/ path with path to your application.

Checking if monitoring is working

How to check if monitoring is working? Go to you app root directory and type:

cat log/passenger_monitor.log

You should see something like this:

I, [TIMESTAMP]  INFO -- : Finished checking for bloated Passenger workers
I, [TIMESTAMP]  INFO -- : Checking for bloated Passenger workers
I, [TIMESTAMP]  INFO -- : Finished checking for bloated Passenger workers
I, [TIMESTAMP]  INFO -- : Checking for bloated Passenger workers
I, [TIMESTAMP]  INFO -- : Finished checking for bloated Passenger workers
I, [TIMESTAMP]  INFO -- : Checking for bloated Passenger workers
I, [TIMESTAMP]  INFO -- : Finished checking for bloated Passenger workers
I, [TIMESTAMP]  INFO -- : Checking for bloated Passenger workers
I, [TIMESTAMP]  INFO -- : Finished checking for bloated Passenger workers
I, [TIMESTAMP]  INFO -- : Checking for bloated Passenger workers
I, [TIMESTAMP]  INFO -- : Finished checking for bloated Passenger workers

To see only kill attemps, type:

cat log/passenger_monitor.log | egrep 'ERROR|FATAL'

Result:

E, [TIMESTAMP] ERROR -- : Found bloated worker: 4162 - 151.8MB
E, [TIMESTAMP] ERROR -- : Trying to kill 4162 gracefully...
E, [TIMESTAMP] ERROR -- : Waiting for worker to shutdown...
E, [TIMESTAMP] ERROR -- : Found bloated worker: 24192 - 152.6MB
E, [TIMESTAMP] ERROR -- : Trying to kill 24192 gracefully...
E, [TIMESTAMP] ERROR -- : Waiting for worker to shutdown...
E, [TIMESTAMP] ERROR -- : Found bloated worker: 3425 - 150.3MB
E, [TIMESTAMP] ERROR -- : Trying to kill 3425 gracefully...
E, [TIMESTAMP] ERROR -- : Waiting for worker to shutdown...

Copyright © 2024 Closer to Code

Theme by Anders NorenUp ↑